
July 25, 2026


TL;DR:
- Conversion optimization is a data-driven process focused on increasing the percentage of website visitors who complete desired actions while maximizing existing traffic. It involves iterative testing and user experience improvements to systematically reduce friction, leading to more leads and revenue without additional ad spending. Prioritizing high-traffic, high-intent pages and maintaining statistical rigor in testing are essential for building sustainable, compounded growth.
Conversion optimization is the data-driven process of increasing the percentage of website visitors who complete a desired action, whether that’s making a purchase, submitting a form, or requesting a demo. Known formally as Conversion Rate Optimization (CRO), it focuses on maximizing the value of traffic you already have rather than spending more to attract new visitors. Tools like Hotjar, platforms like Shopify, and guides from HubSpot all confirm that CRO combines iterative testing with user experience improvements to systematically remove friction from the path to conversion. For marketing professionals and business owners, this means more leads and revenue without increasing ad spend.
What is conversion rate and why does it matter?
Conversion rate is calculated as conversions divided by total visitors, multiplied by 100. A site receiving 10,000 monthly visitors with 200 purchases has a 2% conversion rate. That number is your baseline, and without it, you have no way to measure whether any change you make actually works.
The financial case for CRO is straightforward. Improving conversion rate grows revenue without increasing traffic or ad spend, which directly lowers your effective cost per lead. Doubling your conversion rate from 1% to 2% produces the same revenue impact as doubling your traffic budget. That’s a fundamentally more efficient use of marketing dollars.
Conversion rates vary significantly by industry and page type. The table below shows typical ranges to help you benchmark your own performance:
| Industry / Page Type | Typical Conversion Rate |
|---|---|
| E-commerce (purchase) | 1% to 4% |
| SaaS (free trial signup) | 3% to 7% |
| Lead generation (form fill) | 5% to 15% |
| Landing pages (paid traffic) | 2% to 10% |
| Pricing page (upgrade click) | 4% to 8% |
These ranges are starting points, not ceilings. A well-optimized landing page in a competitive niche can outperform its industry average by a factor of two or three through disciplined testing and friction removal.
Key metrics to track alongside conversion rate include:
- Bounce rate: Visitors who leave without interacting signal a mismatch between ad promise and page content.
- Time on page: Low time combined with low conversion often means your value proposition isn’t landing.
- Scroll depth: If users aren’t reaching your CTA, the problem may be layout, not copy.
- Exit rate by page: Identifies where users abandon the funnel before converting.
What are the main strategies and tools used in conversion optimization?
CRO strategy rests on one principle: test one change at a time, measure the result, and repeat. The most widely used method is A/B testing, where you split traffic between a control version and a variant to determine which performs better. Multivariate testing goes further, testing multiple elements simultaneously to find the best combination, though it requires significantly more traffic to reach statistical significance.
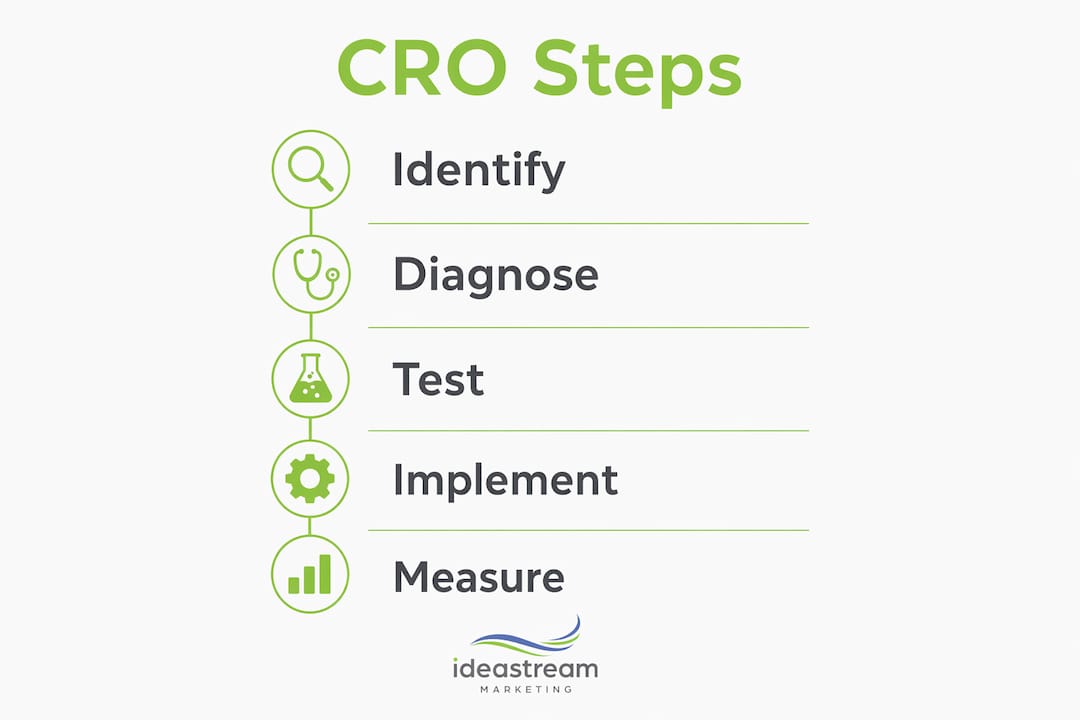
Here is the core iterative cycle every CRO program should follow:
- Establish your baseline. Record current conversion rates by page and traffic source before touching anything.
- Identify friction points. Use behavioral analytics tools to find where users hesitate, rage-click, or drop off.
- Form a hypothesis. Write a specific, testable statement: “Changing the CTA button from gray to green will increase clicks by 15% because it improves visual contrast.”
- Design and launch the test. Split traffic evenly, run the test to your pre-calculated sample size, and resist the urge to check results daily.
- Analyze and implement. If the variant wins with statistical confidence, deploy it. If not, document what you learned and form a new hypothesis.
- Repeat. CRO is not a project with an end date. It’s a continuous program.
Hotjar is one of the most practical tools for steps two and three. Its heatmaps and session recordings show exactly where users click, how far they scroll, and where they express frustration through rage clicks or dead clicks. Surveys within Hotjar let you ask visitors directly why they didn’t convert, which often surfaces objections your analytics data alone would never reveal.
For paid traffic, Google Ads Experiments provide a structured way to test landing page variants before testing ad copy changes. This sequencing matters because landing page improvements affect every visitor regardless of which ad brought them there.

Pro Tip: Start your CRO program with heatmaps on your highest-traffic pages. You’ll often find that users are clicking on non-clickable elements or ignoring your primary CTA entirely. That data alone can generate your first three test hypotheses in under an hour.
What are the critical considerations for statistical validity in CRO?
Running a test without proper statistical planning is worse than not testing at all. It produces false confidence in results that don’t hold up. A/B tests require pre-calculated sample sizes based on four inputs: your baseline conversion rate, the minimum detectable effect (MDE) you care about, your confidence level (typically 95%), and statistical power (typically 80%). Skipping this step is the single most common reason CRO programs produce misleading results.
The most damaging mistake in A/B testing is “peeking,” which means checking results before the test reaches its required sample size and stopping early when you see a promising lift. Premature stopping inflates false positives, making a random fluctuation look like a real improvement. Sequential testing methods and always-valid p-values are more advanced approaches that allow for interim looks without compromising validity, but they require specialized tools.
Practical rules for statistically sound testing:
- Set your sample size and test duration before launching. Commit to both.
- Run tests for a minimum of two full business cycles (typically two weeks) to account for day-of-week behavioral variation.
- Aim for at least 100 conversions per variant before drawing conclusions. For low-traffic pages, this may mean running tests for four to six weeks.
- Never run multiple overlapping tests on the same page unless your tool explicitly supports multivariate segmentation.
- Document every test: hypothesis, start date, sample size target, result, and decision made.
“Proper testing governance includes documenting hypotheses, defining success metrics, verifying tracking, enforcing traffic splits, and committing to scheduled test durations.” — A/B Testing Methodology: Statistical | Digital Codex
Statistical rigor separates teams that build compounding conversion gains from teams that spin their wheels retesting the same inconclusive results.
How to identify and fix user journey friction points
Friction is anything that makes a visitor hesitate, second-guess, or abandon the path to conversion. Common friction points include unclear CTA buttons, forms with too many fields, confusing pricing structures, and slow page load times. Each one is measurable and fixable once you know where to look.
The most effective diagnostic approach combines quantitative and qualitative data. Triangulating heatmaps with user surveys gives you both the “what” and the “why.” A heatmap might show that 70% of users never scroll past the hero section. A follow-up survey might reveal they didn’t understand what the product actually does. That combination points directly to a value proposition problem, not a design problem.
| Friction Type | Diagnostic Tool | Common Fix |
|---|---|---|
| Unclear CTA | Heatmap, session recording | Increase contrast, rewrite button copy |
| Long or complex form | Funnel analysis, recording | Reduce fields, use multi-step format |
| Slow page speed | Google PageSpeed Insights | Compress images, reduce render-blocking scripts |
| Confusing pricing | Survey, exit poll | Simplify tiers, add comparison table |
| Lack of trust signals | Session recording, survey | Add testimonials, security badges, guarantees |
Prioritize fixes based on two factors: how many visitors the friction affects and how close to the conversion point it occurs. A broken CTA button on your pricing page outranks a confusing headline on your blog sidebar every time.
Pro Tip: After fixing a friction point, re-test it. Changes that solve one problem sometimes introduce another. A shorter form might increase submissions but attract lower-quality leads. Validate the full impact before declaring a win.
Where on your website should you focus your CRO efforts?
Not every page deserves equal attention. The highest-impact areas for optimizing landing pages and other key pages are those where visitors are closest to making a decision.
Focus your efforts in this order:
- Home page: Clarify your value proposition above the fold. Visitors should understand what you do and who you serve within five seconds of arriving.
- Pricing page: Simplify tier structures, highlight the most popular plan, and add a comparison table. Pricing page confusion is one of the most common causes of SaaS churn before trial even begins.
- Landing pages: Each paid traffic landing page should match the specific ad that sent the visitor there. Mismatched messaging between ad and page is a direct conversion killer.
- CTA buttons: Test copy, color, placement, and size. “Get Started” consistently underperforms against specific, benefit-driven alternatives like “Start My Free Trial” or “See My Custom Quote.”
- Lead capture forms: Every additional field reduces completion rates. Ask only for what you need to take the next step with that lead.
CRO and SEO are not competing priorities. A well-optimized website that loads fast, communicates clearly, and guides users toward action also tends to rank better because Google measures engagement signals like dwell time and bounce rate. Treating them as a unified system produces better results than optimizing each in isolation.
Key takeaways
Conversion optimization works because it compounds: each incremental improvement to your conversion rate multiplies the return on every dollar you spend driving traffic.
| Point | Details |
|---|---|
| Define your baseline first | Calculate your current conversion rate before launching any test or making any changes. |
| Use behavioral tools | Hotjar heatmaps and session recordings reveal friction points that analytics dashboards miss entirely. |
| Commit to statistical rigor | Pre-calculate sample sizes and never stop a test early based on promising early results. |
| Prioritize high-intent pages | Focus CRO efforts on pricing pages, landing pages, and CTAs where decisions actually happen. |
| Treat CRO as a program | Ongoing CRO programs outperform one-off fixes because gains compound over time with each validated test. |
What most CRO guides won’t tell you
After working with businesses across industries, the pattern I see most often isn’t a lack of testing. It’s a lack of patience. Teams run a test for five days, see a 12% lift, declare victory, and move on. Three months later, they can’t explain why conversions dropped back to baseline. The lift was noise. The test never reached statistical significance.
The second most common mistake is ignoring mobile UX entirely. A desktop heatmap looks clean, but the mobile session recording shows users pinching to zoom into a CTA that’s too small to tap. Mobile traffic often represents more than half of total visits, and it consistently converts at lower rates than desktop. That gap is almost always a friction problem, not an intent problem.
My honest recommendation: treat your CRO program the way you treat your financial reporting. Set a cadence, document everything, and never make a decision based on data that hasn’t been properly validated. The businesses that build real conversion gains are the ones that stay disciplined when the early numbers look exciting and stay curious when a test fails. Both outcomes teach you something. The discipline to act on data rather than instinct is what separates teams that grow from teams that guess.
— Dean
How Idea Stream Marketing can help you convert more visitors
At Idea Stream Marketing, we build digital marketing systems designed to turn website traffic into real business results. Our data-driven web design process integrates conversion best practices from the ground up, so your site isn’t just visually strong but structurally built to guide visitors toward action. We pair that with AI SEO services that attract higher-quality traffic, which makes every conversion optimization effort work harder.

Whether you’re starting your first CRO program or looking to fix a funnel that’s leaking leads, our team is ready to build a strategy around your specific goals. Schedule a consultation with Idea Stream Marketing and let’s put your traffic to work.
FAQ
What is conversion optimization in simple terms?
Conversion optimization is the process of increasing the percentage of website visitors who take a specific desired action, such as buying, signing up, or requesting a quote. It uses data, testing, and user behavior analysis to remove friction from the path to that action.
How do I calculate my conversion rate?
Divide the number of conversions by total visitors, then multiply by 100. For example, 300 form submissions from 10,000 visitors equals a 3% conversion rate.
How long should an A/B test run?
Most A/B tests should run for a minimum of two full business cycles, typically two weeks, and reach at least 100 conversions per variant before results are considered reliable. Tests on low-traffic pages may require four to six weeks.
What tools are used for conversion rate optimization?
Hotjar is widely used for heatmaps, session recordings, and on-site surveys. Google Ads Experiments supports landing page testing for paid traffic. Sample size calculators help plan statistically valid tests before launch.
What pages should I optimize first?
Start with your highest-traffic, highest-intent pages: pricing pages, primary landing pages, and any page containing a lead capture form or primary CTA. These pages have the most direct impact on revenue.